How to Automate Financial Reporting and Save Hours Every Month
Discover how financial reporting automation eliminates manual spreadsheet work, delivers real-time insights, and helps CFOs make faster decisions.
What Is Financial Reporting Automation?
Financial reporting automation is the use of software to collect, consolidate, and present financial data in standardized reports without manual spreadsheet work. Instead of a finance team spending the first two weeks of every month pulling data from multiple systems, pasting it into Excel, writing formulas, formatting tables, and emailing PDF reports to stakeholders, automated reporting platforms do this continuously and on demand.
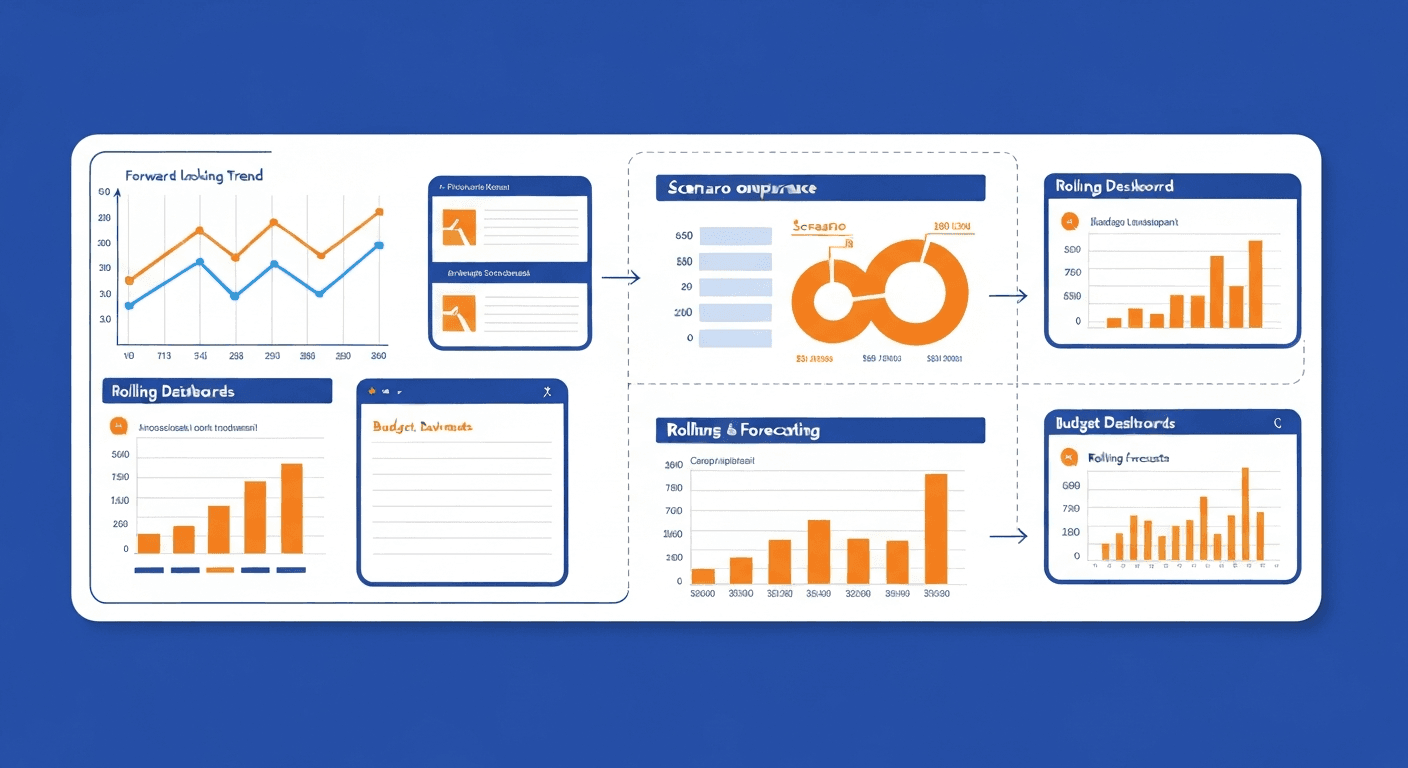
A modern financial reporting automation system connects directly to your accounting software, bank accounts, payroll system, billing platform, and other financial data sources. It pulls transaction-level data in real time, applies your chart of accounts and reporting rules, and generates reports like the profit and loss statement, balance sheet, cash flow statement, budget vs. actual comparisons, and departmental breakdowns automatically. Dashboards update live, and scheduled reports are delivered to stakeholders without anyone touching a spreadsheet.
For CFOs, controllers, and finance managers, this means shifting from spending the majority of their time compiling data to spending it analyzing data and advising the business.
Why Is Manual Financial Reporting a Problem?
If your monthly close process involves downloading CSV exports, copying data between spreadsheets, and manually building reports, you are dealing with several structural problems that automation solves.
- It takes too long. Research from BlackLine shows that the average month-end close takes 6.4 business days for mid-size companies. Much of that time is spent on data gathering and reconciliation rather than analysis. Automation can compress this to 1 to 3 days.
- It is error-prone. A single broken formula or incorrect cell reference in a spreadsheet can cascade through an entire reporting package. According to research from the University of Hawaii, 88% of spreadsheets contain errors. When financial decisions are based on erroneous reports, the consequences can be severe.
- It produces stale information. By the time a manually prepared monthly report reaches decision-makers, the data is already two to three weeks old. In a fast-moving business, that delay can mean missed opportunities or undetected problems.
- It does not scale. Adding a new department, cost center, or business unit to a manual reporting process means creating new spreadsheets, formulas, and workflows. Automated systems handle this with configuration changes rather than new manual processes.
- It burns out your finance team. When skilled finance professionals spend most of their time on repetitive data compilation rather than strategic analysis, they disengage. This contributes to the high turnover rates seen in accounting and finance roles.
What Financial Reports Can You Automate?
Virtually every standard financial report can be automated. Here are the most common ones and how automation improves each.
Profit and Loss Statement (Income Statement)
The P&L shows revenue, expenses, and net income for a given period. Automated systems generate it in real time from your general ledger, broken down by any dimension you need: department, product line, location, project, or customer segment.
Automation advantage: Instead of waiting until month-end to see profitability, you can check the current P&L at any point in the month. This enables proactive management rather than reactive surprises.
Balance Sheet
The balance sheet shows assets, liabilities, and equity at a point in time. Automation ensures it is always current and reconciled against sub-ledgers.
Automation advantage: Automated reconciliation between the balance sheet and supporting schedules (accounts receivable aging, accounts payable aging, fixed asset register) catches discrepancies immediately rather than during the close process.
Cash Flow Statement
The cash flow statement shows how cash moves in and out of the business across operating, investing, and financing activities. This is often the most painful report to prepare manually because it requires analyzing changes across multiple balance sheet and income statement accounts.
Automation advantage: The system calculates cash flow directly from transaction data, eliminating the manual indirect method calculations that are prone to error.
Budget vs. Actual Reports
These reports compare planned spending and revenue against actual results, typically at the department or cost center level. They are critical for financial accountability but tedious to prepare manually.
Automation advantage: When connected to your budgeting and forecasting system, actuals populate automatically, variances are calculated in real time, and alerts are triggered when spending exceeds thresholds.
Accounts Receivable Aging
The AR aging report shows outstanding customer invoices by age bucket (current, 30 days, 60 days, 90+ days). It is essential for managing cash flow and credit risk.
Automation advantage: When integrated with automated invoicing, the aging report updates in real time as invoices are sent, payments are received, and due dates pass.
Accounts Payable Aging
The AP aging report shows what you owe vendors and when it is due. This informs cash management decisions and helps you take advantage of early payment discounts.
Automation advantage: Integrated with accounts payable automation, this report provides a live view of upcoming payment obligations without manual compilation.
What Are the Best Financial Reporting Automation Tools?
The right tool depends on your business size, accounting system, and reporting complexity.
For Small Businesses
- Fathom. Connects to QuickBooks, Xero, and MYOB. Generates visual financial reports, KPI dashboards, and management reports with minimal setup. Excellent for small businesses that want professional-looking reports without enterprise software. Pricing starts at $39/month.
- Reach Reporting. Built specifically for small business financial reporting. Connects to QuickBooks and Xero, offers customizable dashboards, and supports multi-company consolidated reporting. Starts at $99/month.
- LivePlan. Combines financial forecasting with actual-vs-planned reporting. Pulls data from QuickBooks and Xero and generates visual dashboards that are easy for non-financial stakeholders to understand.
For Mid-Size Businesses
- Vena Solutions. Uses Excel as its front end, which means your finance team can work in a familiar environment while the back end handles data consolidation, version control, and workflow automation. Excellent for businesses where the team knows Excel deeply but needs to eliminate its risks.
- Datarails. Another Excel-native platform that automates data collection from ERPs, CRMs, and other sources into existing Excel reports. It preserves your current report formats while eliminating the manual data gathering.
- Cube. A spreadsheet-native FP&A platform that connects to your data sources and powers analysis in Excel and Google Sheets. Strong for mid-market companies that need planning and reporting in one tool.
For Larger Organizations
- Workiva. Enterprise-grade platform for complex regulatory and management reporting. Used by thousands of public companies for SEC filings. Provides collaboration, audit trails, and XBRL tagging.
- OneStream. A unified finance platform that handles consolidation, reporting, planning, and analytics for large, complex organizations. Replaces multiple legacy systems with a single solution.
- SAP Analytics Cloud. For businesses on the SAP ecosystem, this tool provides automated financial reporting with built-in planning and predictive analytics capabilities.
How Do You Implement Financial Reporting Automation?
A successful implementation follows a structured approach that starts with your most critical reports and expands from there.
Step 1: Map Your Current Reports
Create an inventory of every financial report your organization produces. For each report, document:
- Who requests or receives it
- How frequently it is produced (daily, weekly, monthly, quarterly)
- Where the source data comes from
- How long it takes to prepare
- What manual steps are involved
- How critical it is to business decisions
Step 2: Prioritize by Impact
Rank your reports by the combination of preparation time and business value. The reports that take the longest to prepare and are used for the most important decisions should be automated first. Typically, the monthly P&L, cash flow report, and budget vs. actual comparisons top the list.
Step 3: Ensure Clean Source Data
Automation amplifies the quality of your source data, whether that quality is good or bad. Before connecting reporting tools to your accounting system, make sure your chart of accounts is well-structured, transactions are categorized consistently, and reconciliations are current. Automating reports from messy books just produces messy reports faster.
Step 4: Connect Your Data Sources
Integrate the reporting platform with your accounting software, banking feeds, payroll system, billing platform, and any other systems that generate financial data. Most modern reporting tools offer native integrations with QuickBooks, Xero, Sage, and NetSuite.
Step 5: Build Report Templates
Configure your report templates to match the formats your stakeholders are accustomed to. Automated does not have to mean different. The best implementations produce reports that look exactly like what people are used to seeing, but are generated in minutes instead of days.
Step 6: Set Up Scheduling and Distribution
Configure automatic report generation and delivery. Common setups include:
- Daily: Cash position report and sales summary
- Weekly: AR aging, AP aging, and expense summary
- Monthly: Full financial reporting package (P&L, balance sheet, cash flow, budget vs. actual)
- Quarterly: Board reporting package and tax provision estimates
Step 7: Build Dashboards for Self-Service
In addition to scheduled reports, create live dashboards that stakeholders can access on demand. Department heads should be able to check their budget status without waiting for a monthly report. Executives should be able to see key financial metrics in real time.
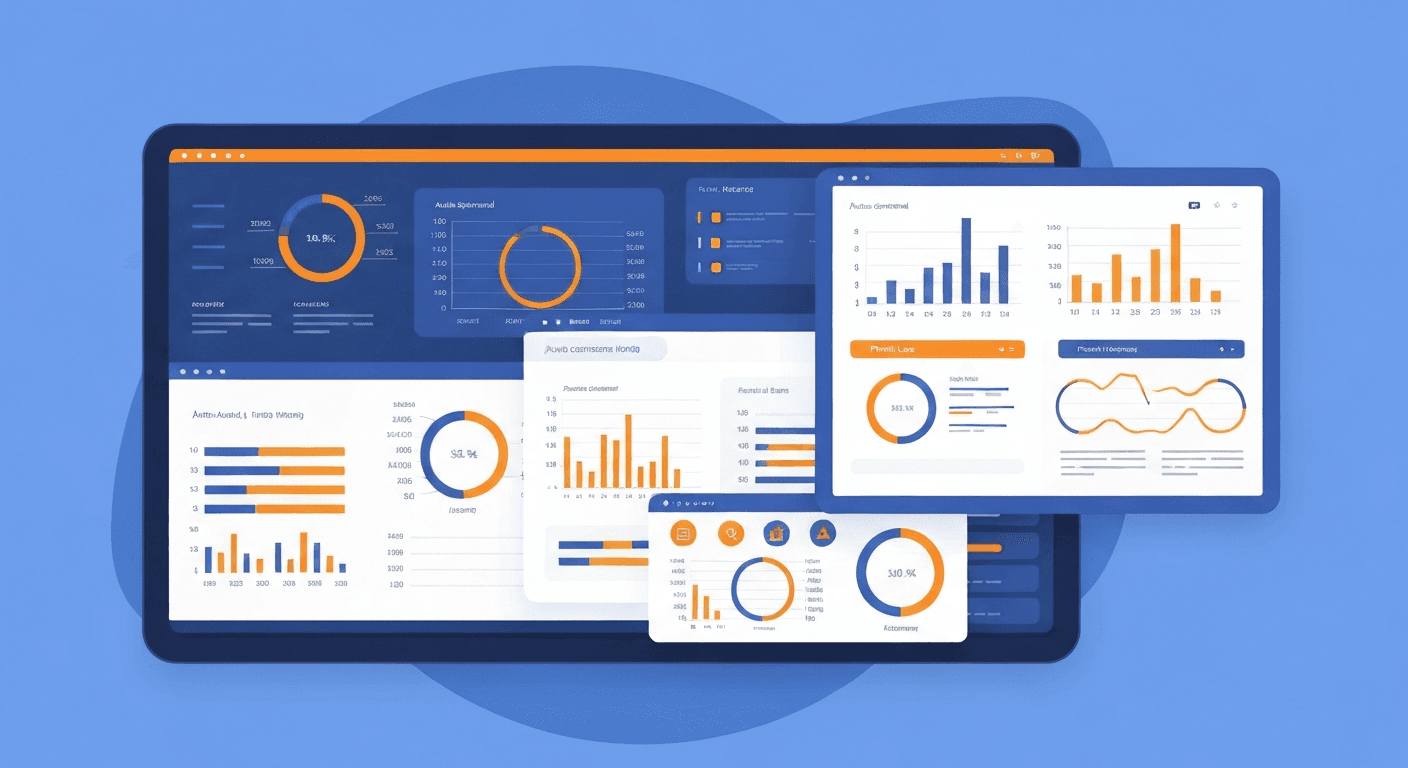
What KPIs Should Your Automated Financial Reports Track?
Beyond the standard financial statements, automated reporting enables you to monitor key performance indicators continuously. The most valuable financial KPIs for small and mid-size businesses include:
- Gross margin by product or service line. Understand which offerings are most profitable and where margins are eroding.
- Operating expense ratio. Track operating expenses as a percentage of revenue to spot efficiency trends.
- Days sales outstanding (DSO). Monitor how quickly customers pay, and catch slowdowns before they become cash flow crises.
- Days payable outstanding (DPO). Track how long you take to pay vendors, balancing cash preservation against vendor relationship health.
- Current ratio. Current assets divided by current liabilities, a quick indicator of short-term liquidity health.
- Burn rate and runway. For startups and growth-stage businesses, automated tracking of monthly cash burn and remaining runway is critical.
- Revenue growth rate. Month-over-month and year-over-year revenue trends, broken out by segment.
- Customer acquisition cost (CAC) and lifetime value (LTV). When financial data is combined with marketing and sales data, these unit economics become visible and actionable.
What Are the Biggest Mistakes in Financial Reporting Automation?
Avoid these common pitfalls when automating your reporting:
- Automating bad processes. If your chart of accounts is a mess, your expense categorization is inconsistent, or your reconciliations are behind, fix those issues first. Automation will not compensate for poor data quality.
- Building too many reports. Start with the five to ten reports that genuinely drive decisions, and do them well. You can always add more later. A dashboard with 50 metrics that no one looks at is worse than 5 metrics that everyone monitors.
- Ignoring the narrative. Numbers without context are meaningless. The best financial reports include commentary explaining what happened and why. Some reporting tools allow you to embed notes and commentary alongside automated data.
- Not testing thoroughly. Before distributing automated reports to stakeholders, validate every number against your existing manual reports. Run parallel for at least two reporting cycles.
- Failing to maintain the system. When you add a new revenue stream, cost center, or business unit, the reporting system needs to be updated. Assign clear ownership for maintaining report configurations.
How Much Time Does Financial Reporting Automation Actually Save?
The time savings are substantial and measurable. A typical mid-size business finance team spends:
- 15 to 20 hours per month on data gathering and consolidation
- 10 to 15 hours per month on report formatting and distribution
- 5 to 10 hours per month on error correction and reconciliation
Automation can reduce data gathering to near zero (since data flows automatically), eliminate manual formatting entirely, and dramatically reduce error correction. In practice, most businesses report that financial reporting automation saves 25 to 40 hours per month for their finance team.
Those hours are not just recovered; they are redirected to higher-value activities like variance analysis, forecasting, strategic planning, and supporting operational decision-making across the business. Combined with automation across other finance workflows like expense tracking and tax preparation, the cumulative time savings can effectively add a full-time analyst's capacity to a small finance team without adding headcount.
Harry Harrison
Founder & Editor, Easy Automation
Tech-forward B2B writer and content strategist focused on marketing and finance automation.